ETHAN WALSH
Heart Rhythms
In a cardiac rehabilitation program it is very important to be able to determine if the patients who are exercising are in normal heart rhythms and heart rate ranges. For this reason new patients entering the program are set up with heart monitors so the staff can view their rhythm during the time they are exercising. Throughout my time as an intern I have learned how to recognize normal rhythms and several abnormalities that can occur, a skill that is critical for the staff to be proficient in to ensure safety for the patients.
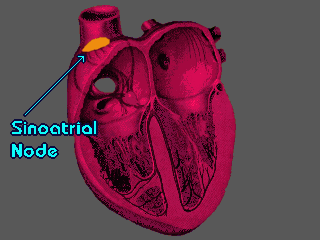
In order to gain an understanding about the heart’s electrical conduction system, a strong foundation in cardiac anatomy and physiology is necessary. An example, the pacemaker for the heart, the SA node, is located in the right atrium. The impulse originating from the SA node travels to the atria and ventricles, resulting in a full cardiac cycle. The reason for mentioning this is to demonstrate that knowledge of the anatomical structure of the heart is the foundation for understanding the conduction system.
The heart is a muscle; it is comprised of a kind of muscle tissue called cardiac muscle. The heart has the job of pumping blood to the lungs and to the entire body, and blood flow follows a particular path through the four chambers of the heart: the two superior chambers called the atria, and the two inferior chambers called the ventricles. Blood returning from the body enters the right atrium. Upon contraction the right atrium delivers the blood to the right ventricle, which then contracts and delivers blood to the lungs via the pulmonary artery. After cycling through the lungs where gas exchange occurs, the blood returns to the heart by way of the pulmonary vein to the left atrium. The next step involves delivery to the left ventricle, from which blood is ejected to the body when the left ventricle contracts.
The beating of the heart relies on its ability to create electrical conductions that result in contractions and movement of blood. Each cell in the myocardium has the ability to create conduction and pass on electrical impulses generated by cells around them. As mentioned before, during a normal rhythm the initial impulse is generated by the SA node and the conduction travels from there.
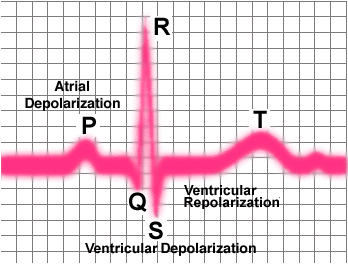
By placing electrodes strategically on an individual’s body, the electrical impulses generated by the heart can be measured and displayed for observation. Below is a diagram of a normal heart rhythm. The basic configurations that are seen on an EKG include the P wave, QRS complex, and T wave. When observing a patient’s heart rhythm there are several components that need to be addressed. Components of a rhythm include duration, amplitude, and configuration. The horizontal axis on the special graph paper that is used when reading EKG’s represents time measured in seconds. One small block is the equivalent of .04 seconds. This is of importance because each of the configurations should last for a certain amount of time; abnormalities can indicate problems with the conduction system. Amplitude refers to the height and depth of the EKG readings measured in millivolts. One small block represents .1 millivolts.


The main configurations during a cardiac cycle have been mentioned, but what do they actually mean? The first wave is the P wave. The P wave represents electrical activity during the depolarization of the atria. The initial impulse originates from the SA node and spreads through the atria causing contraction and the delivery of blood to the ventricles. There is then a pause in electrical activity due to the atrioventricular node’s function of slowing down conduction in order to allow the atria to completely empty. This ensures that the ventricles receive all the blood being delivered. The next configuration is the QRS complex. This represents ventricular depolarization and the contraction of the ventricles. Finally repolarization of the ventricles occurs and the concluding wave is the T wave.
After understanding the basics of a normal rhythm, one can begin to distinguish between a normal rhythm and arrhythmias. Below are some examples and explanations of a few arrhythmias I have observed during my time as an intern.
Atrial Fibrilation
Atrial Fibrillation can be recognized when no true P wave can be seen along with the irregularly irregular appearance of the QRS complex. This is caused by chaotic atrial activity which results in a bombardment of impulses reaching the AV node and ultimately only allowing some of the impulses to reach the ventricles.
Right Bundle Branch Block
Another arrhythmia is the right bundle branch block. When this occurs, right ventricular depolarization is delayed due to impulse conduction becoming obstructed through the right bundle. This delay increases the total time for ventricular depolarization to occur and the QRS complex configuration widens along the horizontal beyond normal parameters, which indicates this increase in time. The QRS complex also presents with a unique shape: it begins with the initial R wave deflecting in the positive direction (upwards) followed by the S wave deflecting in the negative direction (downwards). The unique shape comes from a second R wave, this is labeled R’ and indicates right ventricular depolarization which has been delayed.
Premature Ventricular Contraction
It is not uncommon for people who have normal healthy hearts to experience this next type of abnormal rhythm. The QRS complex of a premature ventricular contraction appears wide and bizarre due to ventricular depolarization not following normal conduction pathways. Premature ventricular contractions presenting in isolation do not require treatment, however runs of several in a row seem to increase risk for inducing ventricular tachycardia or ventricular fibrillation.


